Data Analysis > Descriptive Statistics > Histogram of a Continuous Variable
Histogram of a Continuous Variable
In our example data set we have a selected variable named “wscore”. Let us construct a histogram.
From previous section, We have the data Frame named “df” the variables are:
> names(df)
"HL3" "gender" "HL5Y" "HL6" "HH6" "HH7" "HH7A" "wscore" "ethnicity" "helevel" "schage"
To find the descriptive statistics of wscore the command is:
> summary(df$wscore)

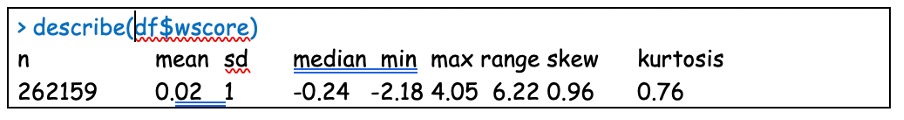
Where is skewness and kurtosis? Lets use another package to have this.
install.packages("psych")
library(psych)
describe(df$wscore)
> describe(df$wscore)
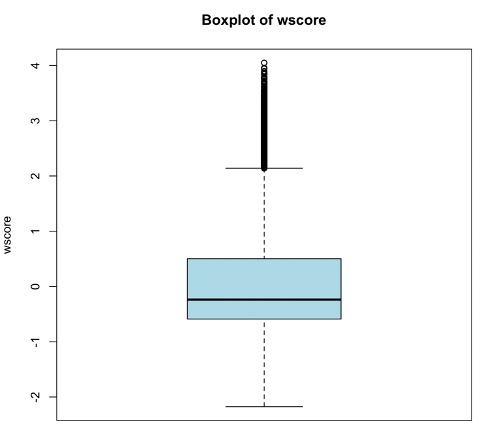
To visualize these above we need to construct BoxPlot:
boxplot(df$wscore, main = "Boxplot of wscore",
ylab = "wscore", col = "lightblue")
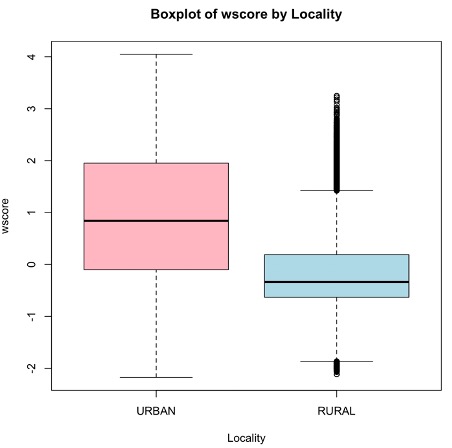
Box-Plot of a single variable group by another categorical variable:
Suppose we want to construct the above box-plot by gender then
boxplot(wscore ~ HH6, data = df, main = "Boxplot of wscore by Locality",
xlab = "Gender", ylab = "wscore", col = c("lightpink", "lightblue"))
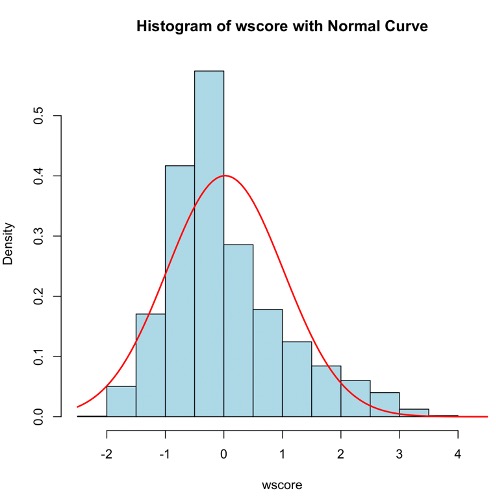
Histogram of a single variable:
hist(df$wscore, breaks = 20, probability = TRUE,
col = "lightblue", main = "Histogram of wscore with Normal Curve",
xlab = "wscore")
curve(dnorm(x, mean = mean(df$wscore, na.rm = TRUE),
sd = sd(df$wscore, na.rm = TRUE)),
col = "red", lwd = 2, add = TRUE)
Frequency table for a Continuous data
No More
Feedback
ABOUT
Statlearner
Statlearner STUDY
Statlearner