Data Analysis > Correlation and Regression > Correlation coefficients and their tests for multiple variables
Combination of correlation coefficients and their tests
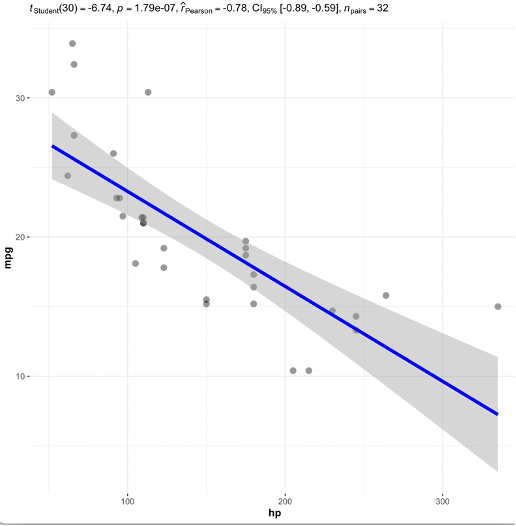
If we need to combine correlation and it’s test for hpand mpg in a plot then we can use the ggscatterstats() function from the {ggstatsplot} package.
// install.packages("ggstatsplot")
library(ggstatsplot)
## plot with statistical results
ggscatterstats(data = mtcars, x = hp, y = mpg,
bf.message = FALSE, marginal = FALSE # remove histograms)
Correlation Matrix:
Our dataset “mtcars” contains the following variables:
"mpg" "cyl" "disp" "hp" "drat" "wt" "qsec" "vs" "am" "gear" "carb"
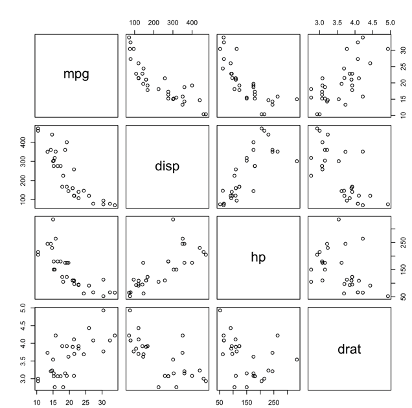
Scatterplots for Several pairs of Variables:
Correlation between pairs of variables can be visualized using scatterplot.
If we want to visualize the relationship for several pairs of variables:
pairs(mtcars[, c("mpg", "disp","hp","drat")])
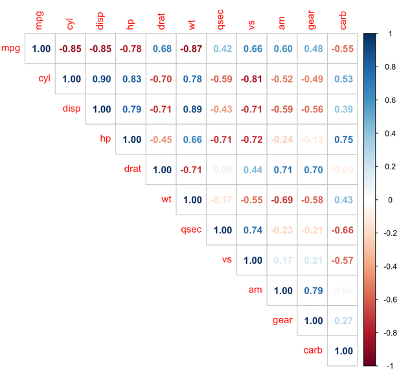
We can compute correlation of all pairs of variables:
round(cor(mtcars),digits = 2 )
Another readable way to calculate correlation as:
install.packages("corrplot")
library(corrplot)
corrplot(cor(mtcars), method = "number", type = "upper" )
Feedback
ABOUT
Statlearner
Statlearner STUDY
Statlearner