Data Analysis Using Python > Correlation > Test of Correlation Coefficient
Test of Correlation Coefficient
A correlation coefficient test checks whether the observed relationship between two variables is statistically significant. This means the correlation is unlikely to have happened by chance, and it likely reflects a real relationship in the population.
A correlation coefficient of zero means there is no linear relationship between the variables.
The test evaluates whether the sample’s correlation is significantly different from zero, helping to decide if a true linear relationship exists between the two variables in the population.
Hypothesis:
- Null Hypothesis (H0): There is no correlation between the variables in the population (ρ = 0).
- Alternative Hypothesis (H1): There is a correlation between the variables in the population (ρ ≠ 0).
Test Statistic
A t-test is commonly used to evaluate the significance of the correlation coefficient.
The test statistic (t) is calculated using the formula:
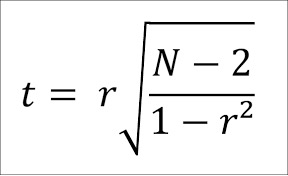
Where 'r' is the sample correlation coefficient and 'n' is the sample size. The degrees of freedom for this test are df = n - 2.
To calculate p-value
When we calculate the test statistic t, it is considered a random variable. This is because if we took a different sample, the value of t might change. Statisticians have shown that the distribution of t follows the Student’s t-distribution.
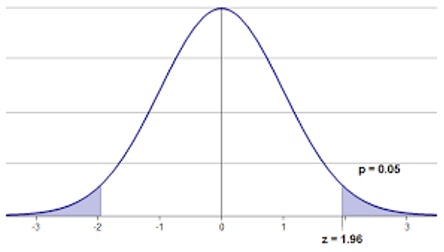
As the sample size (n) becomes large, the t-distribution becomes very similar to the normal distribution (z-distribution). The graph below represents an abstract view of this distribution to aid understanding.
The figure shows that, regardless of the sign, a larger absolute value of z (or t) corresponds to a smaller probability area—meaning it’s less likely to occur by chance.
So, if our t-value is large, the probability of the null hypothesis being true becomes smaller. This probability is known as the p-value. Therefore, to reject the null hypothesis, we look for a larger t-value and a smaller p-value.
Now the question is: How small should the p-value be to reject the null hypothesis?
Statisticians commonly use a rule of thumb: If the p-value is less than 0.05, we reject the null hypothesis.
Python codes:
import pandas as pd
from scipy.stats import pearsonr
wt = [67, 69, 85, 83, 74, 81, 97, 92, 114, 85]
sbp = [120, 125, 140, 160, 130, 180, 150, 140, 200, 130]
# Create DataFrame
Comments:
- r=0.7398 means correlation is intermediate,
- r is positive means correlation is positive i.e. increase in weight also cased in the increase of blood pressure and vice-versa
- p-value is less than 0.05 that is null hypothesis is rejected. i.e. there is not enough evidence in the sample that we can say weight and blood pressure has no relation.
Feedback
ABOUT
Statlearner
Statlearner STUDY
Statlearner